Graphs
Un-Iodized Sea Salt.
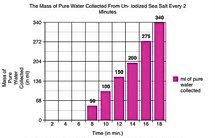
This graph shows how many ml of pure water were collected every time 2 minutes passed. For most of the experiment, the rate of purification was going 25ml/min. Near the end of the experiment, the rate increased. It took a total of 18 minutes for the water to purify completely.
Iodized Table Salt.
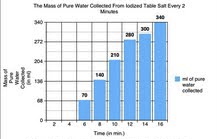
This graph shows how many ml of pure water were collected every time 2 minutes passed. Half the time, the purification was going at a rate of 35ml/min. For the last half of the experiment, the rate was inconsistent. It took a total of 16 minutes for the water to purify completely.
Comparing these two graphs, we can conclude that the iodized table salt purified faster than the un- iodized sea salt. The iodized salt began purifying sooner, and took 2 minutes less than the un- iodized sea salt.
